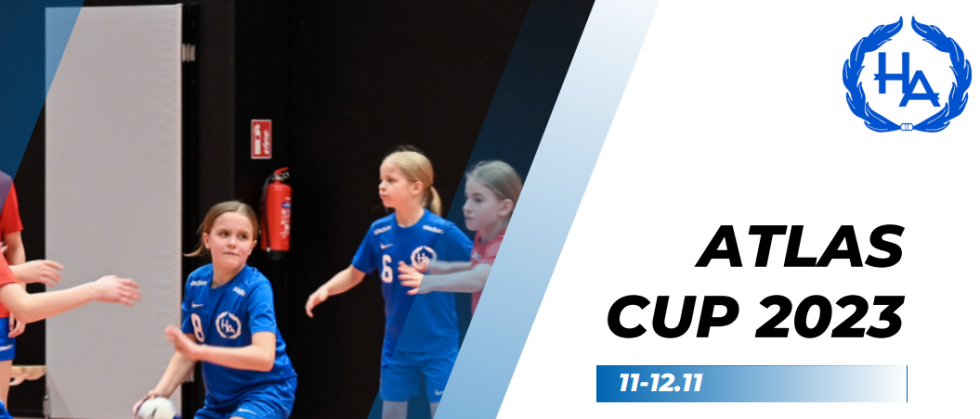
Sie sehen die Ergebnisse der Atlas Cup 2018. Zu den aktuellen Ergebnissen der Atlas Cup 2023 gelangen Sie hier:.
Statistiken
Teilnehmende Städte
Interesting facts
| Number of cities | 22 |
|---|---|
| Northermost city |  Hikiä Hikiä |
| Southernmost city |  Vaiņode Vaiņode |
| Most teams |  Helsinki Helsinki |
| Most scored goals |  Tallinn Tallinn |
| Most goals per team |  Karis Karis |
| Largest share of won matches |  Dragsvik Dragsvik |
| Stadt | Teams | Spiele* | gesp.* | gew. | u. | verl. | Tore | ||||||||||||||||||||||||||||||||||||||||||||||||||||||||||||||||||||||||||||||||||||||||||||||
|---|---|---|---|---|---|---|---|---|---|---|---|---|---|---|---|---|---|---|---|---|---|---|---|---|---|---|---|---|---|---|---|---|---|---|---|---|---|---|---|---|---|---|---|---|---|---|---|---|---|---|---|---|---|---|---|---|---|---|---|---|---|---|---|---|---|---|---|---|---|---|---|---|---|---|---|---|---|---|---|---|---|---|---|---|---|---|---|---|---|---|---|---|---|---|---|---|---|---|---|---|---|
 Anttila Anttila |
1 | 6 | 6 | 1 (16 %) | 0 | 5 (83 %) | 63 - 102 | ||||||||||||||||||||||||||||||||||||||||||||||||||||||||||||||||||||||||||||||||||||||||||||||
 Dragsvik Dragsvik |
1 | 5 | 5 | 5 (100 %) | 0 | 0 (0 %) | 111 - 62 | ||||||||||||||||||||||||||||||||||||||||||||||||||||||||||||||||||||||||||||||||||||||||||||||
 Espoo Espoo |
2 | 9 | 9 | 5 (55 %) | 0 | 4 (44 %) | 113 - 116 | ||||||||||||||||||||||||||||||||||||||||||||||||||||||||||||||||||||||||||||||||||||||||||||||
 Grankulla Grankulla |
4 | 17 | 5 | 4 (80 %) | 0 | 1 (20 %) | 73 - 67 | ||||||||||||||||||||||||||||||||||||||||||||||||||||||||||||||||||||||||||||||||||||||||||||||
 Helsingfors Helsingfors |
6 | 26 | 6 | 5 (83 %) | 0 | 1 (16 %) | 118 - 52 | ||||||||||||||||||||||||||||||||||||||||||||||||||||||||||||||||||||||||||||||||||||||||||||||
 Helsinki Helsinki |
10 | 50 | 42 | 17 (40 %) | 1 | 24 (57 %) | 619 - 617 | ||||||||||||||||||||||||||||||||||||||||||||||||||||||||||||||||||||||||||||||||||||||||||||||
 Hikiä Hikiä |
2 | 11 | 11 | 9 (81 %) | 0 | 2 (18 %) | 194 - 180 | ||||||||||||||||||||||||||||||||||||||||||||||||||||||||||||||||||||||||||||||||||||||||||||||
 Jorvas Jorvas |
1 | 4 | 0 | 0 | 0 | 0 | 0 - 0 | ||||||||||||||||||||||||||||||||||||||||||||||||||||||||||||||||||||||||||||||||||||||||||||||
 Karis Karis |
1 | 7 | 7 | 7 (100 %) | 0 | 0 (0 %) | 131 - 72 | ||||||||||||||||||||||||||||||||||||||||||||||||||||||||||||||||||||||||||||||||||||||||||||||
 Kauniainen Kauniainen |
9 | 44 | 36 | 19 (52 %) | 2 | 15 (41 %) | 496 - 448 | ||||||||||||||||||||||||||||||||||||||||||||||||||||||||||||||||||||||||||||||||||||||||||||||
 Kirkkonummi Kirkkonummi |
5 | 24 | 16 | 4 (25 %) | 3 | 9 (56 %) | 184 - 196 | ||||||||||||||||||||||||||||||||||||||||||||||||||||||||||||||||||||||||||||||||||||||||||||||
 Kyrkslätt Kyrkslätt |
2 | 8 | 0 | 0 | 0 | 0 | 0 - 0 | ||||||||||||||||||||||||||||||||||||||||||||||||||||||||||||||||||||||||||||||||||||||||||||||
 Riihimäki Riihimäki |
3 | 14 | 14 | 6 (42 %) | 0 | 8 (57 %) | 165 - 215 | ||||||||||||||||||||||||||||||||||||||||||||||||||||||||||||||||||||||||||||||||||||||||||||||
 Siuntio Siuntio |
2 | 9 | 9 | 1 (11 %) | 0 | 8 (88 %) | 83 - 150 | ||||||||||||||||||||||||||||||||||||||||||||||||||||||||||||||||||||||||||||||||||||||||||||||
 Tallinn Tallinn |
9 | 46 | 46 | 30 (65 %) | 1 | 15 (32 %) | 803 - 649 | ||||||||||||||||||||||||||||||||||||||||||||||||||||||||||||||||||||||||||||||||||||||||||||||
 Tapa Tapa |
1 | 5 | 5 | 1 (20 %) | 1 | 3 (60 %) | 78 - 81 | ||||||||||||||||||||||||||||||||||||||||||||||||||||||||||||||||||||||||||||||||||||||||||||||
 Turku Turku |
2 | 8 | 4 | 0 (0 %) | 0 | 4 (100 %) | 19 - 74 | ||||||||||||||||||||||||||||||||||||||||||||||||||||||||||||||||||||||||||||||||||||||||||||||
 Vaiņode Vaiņode |
1 | 6 | 6 | 2 (33 %) | 0 | 4 (66 %) | 98 - 126 | ||||||||||||||||||||||||||||||||||||||||||||||||||||||||||||||||||||||||||||||||||||||||||||||
 Vanda Vanda |
2 | 10 | 10 | 4 (40 %) | 0 | 6 (60 %) | 169 - 152 | ||||||||||||||||||||||||||||||||||||||||||||||||||||||||||||||||||||||||||||||||||||||||||||||
 Vantaa Vantaa |
9 | 42 | 34 | 11 (32 %) | 0 | 23 (67 %) | 438 - 588 | ||||||||||||||||||||||||||||||||||||||||||||||||||||||||||||||||||||||||||||||||||||||||||||||
 Viimsi Viimsi |
2 | 9 | 9 | 4 (44 %) | 0 | 5 (55 %) | 123 - 156 | ||||||||||||||||||||||||||||||||||||||||||||||||||||||||||||||||||||||||||||||||||||||||||||||
 Viro Viro |
2 | 12 | 12 | 7 (58 %) | 0 | 5 (41 %) | 199 - 174 | ||||||||||||||||||||||||||||||||||||||||||||||||||||||||||||||||||||||||||||||||||||||||||||||
| * Da jedes Spiel von zwei Teams bestritten wird, weist die Tabelle die doppelte Anzahl der Spiele als tatsächlich aus | |||||||||||||||||||||||||||||||||||||||||||||||||||||||||||||||||||||||||||||||||||||||||||||||||||||


